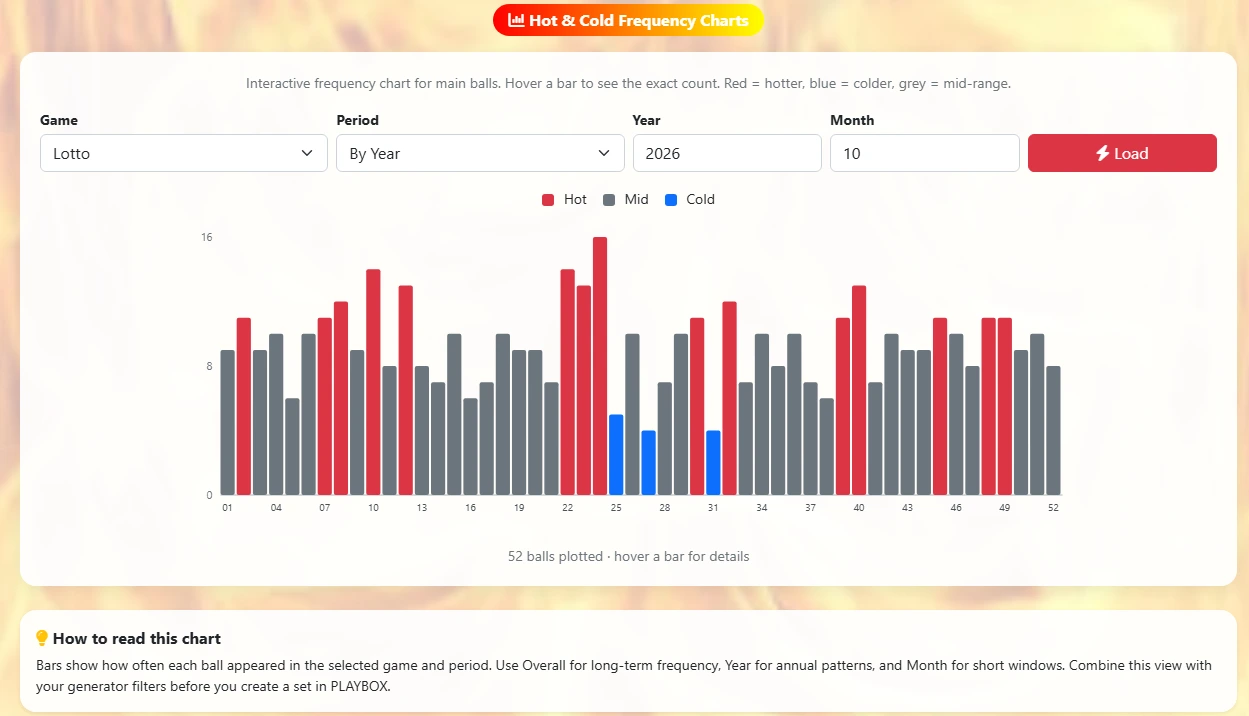
Interactive frequency chart for main balls. Hover a bar to see the exact count. Red = hotter, blue = colder, grey = mid-range.
Bars show how often each ball appeared in the selected game and period. Use Overall for long-term frequency, Year for annual patterns, and Month for short windows. Combine this view with your generator filters before you create a set in PLAYBOX.